Operational Flood-Monitoring Service with SAR Processing Pipelines in the Cloud
The Water Surface Condition (WSC) team at the National Oceanic and Atmospheric Administration - Center for Satellite Applications and Research (NOAA-STAR) recognizes the critical importance of daily Synthetic Aperture Radar (SAR) processing to facilitate national and international flood monitoring efforts. Utilizing Sentinel-1, Radarsat-2, and Radarsat Constellation Mission SAR data, WSC aims to harness the synergies from multiple sensors for comprehensive flood assessment and support the National Weather Service Flood monitoring team as well as the Federal Emergency Management Agency (FEMA). As flood emergencies often occur during rainy, and thus cloudy atmospheric conditions, SAR has a crucial role in complementing monitoring with optical systems.
By processing these multi-sensor SAR datasets in the cloud, WSC is able to utilize a scalable and flexible approach as well as achieve significant efficiencies. The WSC team utilizes Earth Big Data's software to digest vast and diverse datasets, enhance the speed and accessibility of processed SAR data, and operationalize the deployment of SAR processed data. WSC has also created an on-demand API-based flood monitoring system based on data processed by Earth Big Data.
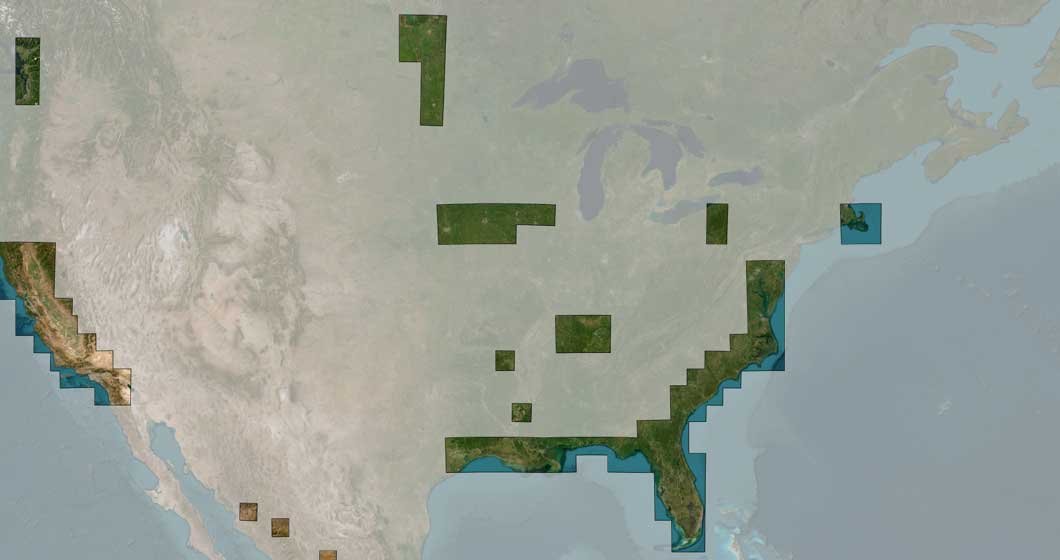
The strategic workflow design involves coupling SAR processing with flood modeling to facilitate SAR/Optical fusion products. To achieve an optical flood prediction, a set of baseline characteristics has been processed from Sentinel-1 data to allow for time series comparison of SAR acquisitions of flood events. These time series are also invaluable for understanding trends and mapping change in water surface conditions over time. The figure below shows the coverage of tiled Sentinel-1 coverage updated daily over the conterminous U.S. and selected regions over Alaska.
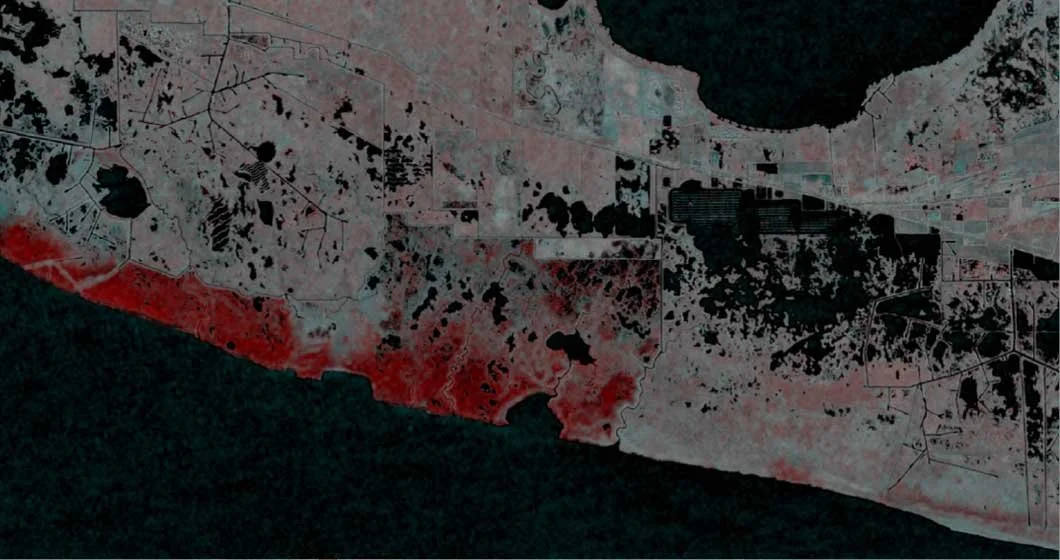
On an Earth Big Data LLC operated web interface (http://remotesensing.earth) these time series are visualized. The interactive use allows for point extraction of time series at 20m resolution in order to understand backscatter from Sentinel-1 ascending and descending observations. In addition, the user can visualize a false color time series image to get a spatial impression of the flood event. In the picture below, we see that a hurricane triggered coastal flooding up to the levees of Louisiana.
The above visualization is automatically produced based on daily checks of available SAR data from over the US coastal and flood-prone interior sites of interest as well as from global observation in regions like Bangladesh or the Mekong River Delta. For this application, Sentinel-1 time-series data stacks are stored in the cloud optimized Zarr format to support fast extraction of time series data.
If you would like more information on this Success Story, please contact us at info@earthbigdata.com